Installing Prometheus Stack on Kubernetes Cluster
In this article, we’ll take Prometheus—previously installed on a Linux VM—and deploy it inside a Kubernetes cluster. With this setup, we’ll not only monitor applications running inside the cluster but also track the cluster itself using essential metrics.

Compared to a VM installation, the Kubernetes setup is slightly different. In Kubernetes, Prometheus runs with the help of Custom Resources (CRDs) managed by the Prometheus Operator. This allows us to collect and visualize metrics from virtually any Kubernetes object in real time. Unlike the Linux VM approach where we used Node Exporter, here we deploy DaemonSets that run exporter Pods on every node, making the process more automated and scalable.
Another important component is Helm, the package manager for Kubernetes. If you’ve worked with Kubernetes before, you know that every application generally requires multiple manifests such as Deployments, Services, Secrets, and ConfigMaps. Helm simplifies this by packaging all these manifests into reusable templates called Charts. With Helm, you can easily install, upgrade, or manage Prometheus Stack, and even create your own Helm Charts to be stored in a personal or shared Helm repository. https://helm.sh/docs/intro/quickstart/
Prerequisites
Before starting, make sure you have the following:
Helm 3 installed (Helm installation guide)
A running Kubernetes cluster (Minikube with Docker Desktop, Kind, or a managed service like EKS, GKE, AKS).
kubectl CLI installed and configured.
Installation
Create a Namespace for Monitoring
kubectl create namespace monitoringAdd the Prometheus Helm Repository
Helm uses repositories to fetch charts. We’ll add the prometheus-community Helm repo, which provides maintained charts for Prometheus and related tools.
helm repo add prometheus-community https://prometheus-community.github.io helm-charts

helm repo update
Install kube-prometheus-stack
The kube-prometheus-stack chart includes Prometheus, Alertmanager, and Grafana in a single package.
helm install prometheus-stack prometheus-community/kube-prometheus-stack --namespace monitoringThis will:
- Deploy Prometheus for metrics collection.
- Deploy Alertmanager for handling alerts.
- Deploy Grafana for dashboards and visualization.
- Deploy necessary exporters (via DaemonSets) for node and pod metrics.
Verify Installation
kubectl get pods -n monitoring
Access Prometheus and Grafana
kubectl port-forward service/prometheus-grafana 8888:80 -n monitoring
Open http://localhost:8888 in your browser.
localhost:8888
After login take your secret to learn your admin and password.
In Kubernetes, a Secret object is used to securely store sensitive information such as passwords, tokens, and API keys, and make it available to Pods when needed.
kubectl get secret -n monitoringkubectl get secret prometheus-stack-grafana -n monitoring -o jsonpath="{.data.admin-password}" | base64 --decode ; echo
Open http://localhost:3000 in your browser.
Default Grafana credentials:
Password: prom-operator (you can change it later)
Username: admin
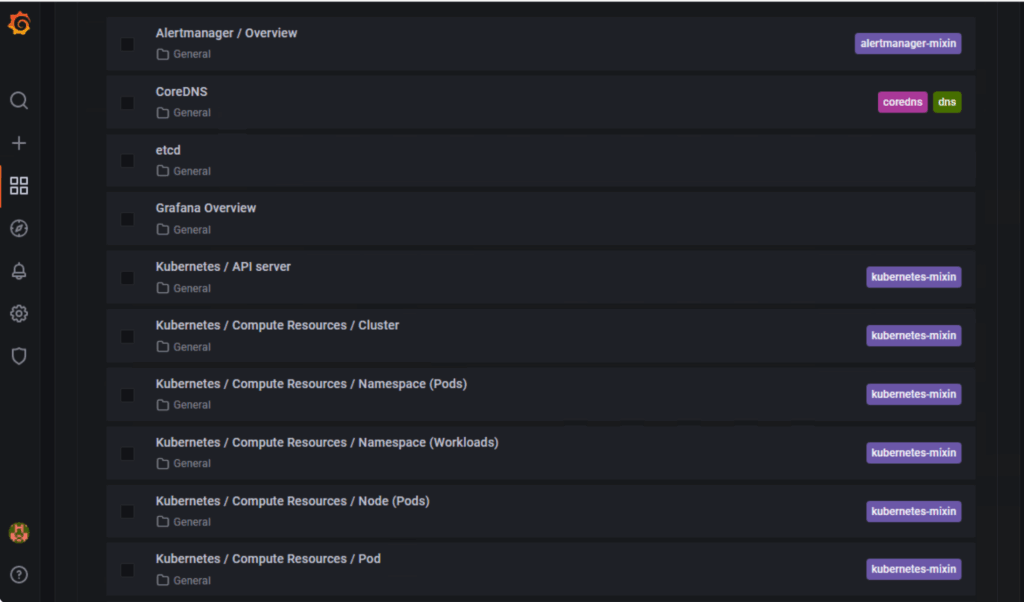
Grafana comes with pre-built dashboards for Kubernetes monitoring. Navigate to Dashboards → Manage in Grafana and you’ll find:
Pod and namespace resource usage
Node Exporter metrics
Kubernetes cluster overview
Grafana comes with pre-built dashboards for Kubernetes monitoring. Navigate to Dashboards → Manage in Grafana and you’ll find:
- Node Exporter metrics
- Kubernetes cluster overview
- Pod and namespace resource usage