Prometheus Stack / Linux Server Installation
What is Prometheus?
rometheus is an open-source monitoring tool that collects metrics and provides visualization tools for the collected data. It is primarily written in GoLang and became part of the Cloud Native Computing Foundation (CNCF) in 2016.
Prometheus also allows you to create alerts when metrics reach predefined thresholds, helping you proactively monitor system health.

Understanding Metrics
Metrics are the fundamental data structures used to represent the state of a system at a given point in time. They are expressed as key-value pairs, where:
Value = Numerical data point
Key = Metric name
Prometheus collects these metrics by querying targets—applications or systems exposing their metrics at a specific HTTP endpoint. Essentially:
The application or system exposes metrics at an HTTP endpoint.
Prometheus sends a GET request to that endpoint.
The returned metric data is collected and stored.
Collected metrics are stored in a time-series database, enabling tracking over time. You can query this data using Prometheus Query Language (PromQL) to generate insights and trigger alerts.
What Types of Metrics Can Prometheus Monitor?
Prometheus is designed to monitor numerical, time-series data. Common types of metrics include:
- Server Metrics: Linux / Windows server health
- Web Servers: Apache, Nginx performance and requests
- Databases: Query performance, connections, transactions
- Resource Utilization: CPU and memory usage
- Disk Metrics: Disk space and I/O
- Service Uptime: Monitoring whether services are running
- Application-specific Data:
- Number of exceptions or errors
- Latency (response time)
- Pending requests
Metrics Prometheus Does Not Monitor
Prometheus is not designed to monitor non-numerical or event-based data such as:
- Events (like system or application events)
- System logs
- Traces
If you want your monitoring system to collect logs and visualize them, use ELK stack.
Prometheus Architecture
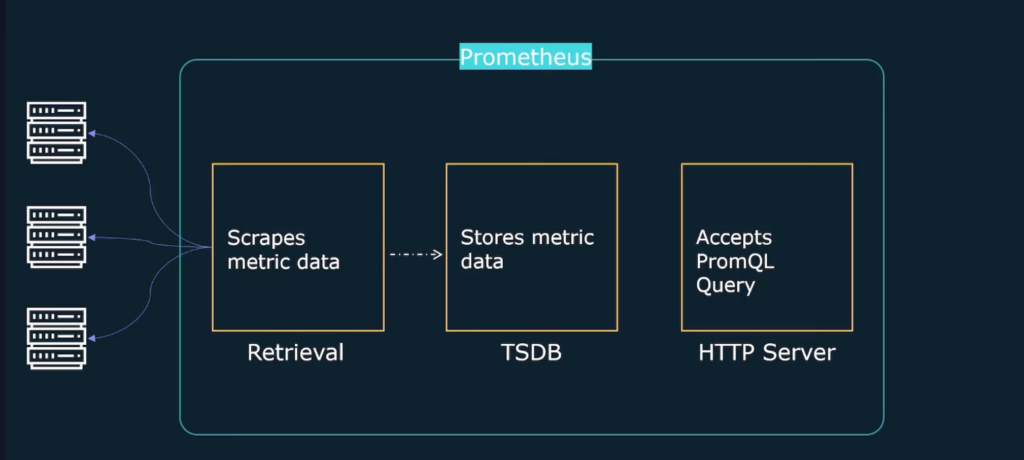
In the previous section, we introduced the three core components of Prometheus: data retrieval, time series database, and HTTP server. In real-world scenarios, the architecture becomes a bit more complex.
Prometheus includes multiple components to provide a complete solution for monitoring your systems or applications.
Note:
By default, your applications, servers, or any system (targets) do not automatically expose metrics in a Prometheus-compatible format. You often need to configure exporters or instrument your applications to expose these metrics correctly.
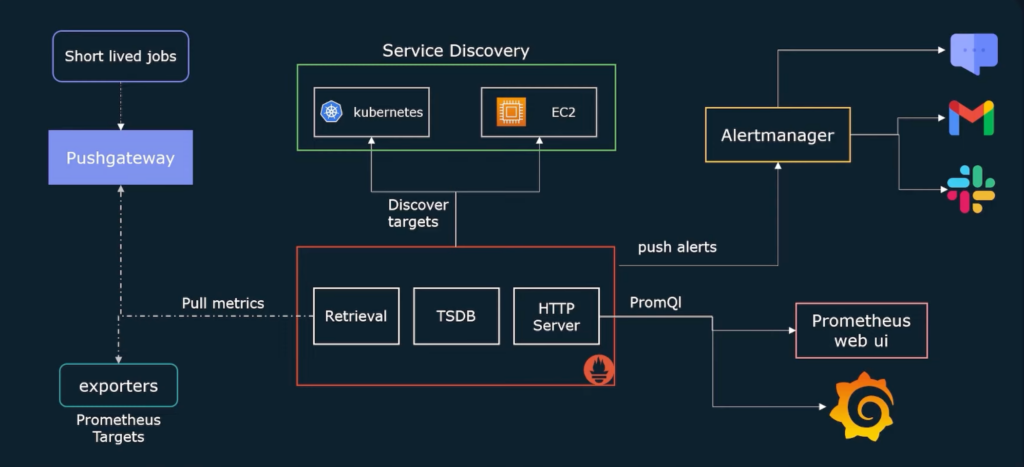
Prometheus Exporters
Exporters are small processes running on your targets that expose metrics so the Data Retrieval Worker can pull them. Prometheus operates on a pull-based model, which means your targets never push data automatically—Prometheus queries them for metrics at regular intervals.
Push Gateway
Sometimes, short-lived jobs cannot work effectively with Prometheus’s pull model. In these cases, the Push Gateway is used. It allows ephemeral processes to push metrics to Prometheus, ensuring that short-lived tasks, which may finish before Prometheus can scrape them, still have their metrics recorded.
Service Discovery
Prometheus needs to know all your monitoring targets. You can statically define them in the prometheus.yml configuration file, but in dynamic environments—like Kubernetes pods or cloud instances (e.g., EC2)—targets can come and go. In such scenarios, service discovery automatically updates Prometheus with the current list of targets, ensuring continuous monitoring.
Alert Manager
Prometheus can generate alerts when metrics cross certain thresholds, but it does not handle notifications directly. To deliver alerts via email, Slack, SMS, or other channels, you need the Alert Manager, which acts as a separate component for routing, silencing, and managing alerts effectively.
| Components | Tasks |
|---|---|
| Alertmanager | Manages alerts and deliver them to externals |
| Prometheus | Collect metrics and create alarms |
| Node Exporter | Provides 3party or local server metrics |
| Gmail SMTP | Used as smtp server to deliver alarms as email format |
Prometheus Installation on Ubuntu
For this example, we will use Ubuntu.
You can either download Prometheus as a binary from the official site and configure it as a service, or install it directly using the package manager.
In this guide, we’ll install directly from package manager.
sudo apt update
sudo apt install prometheus
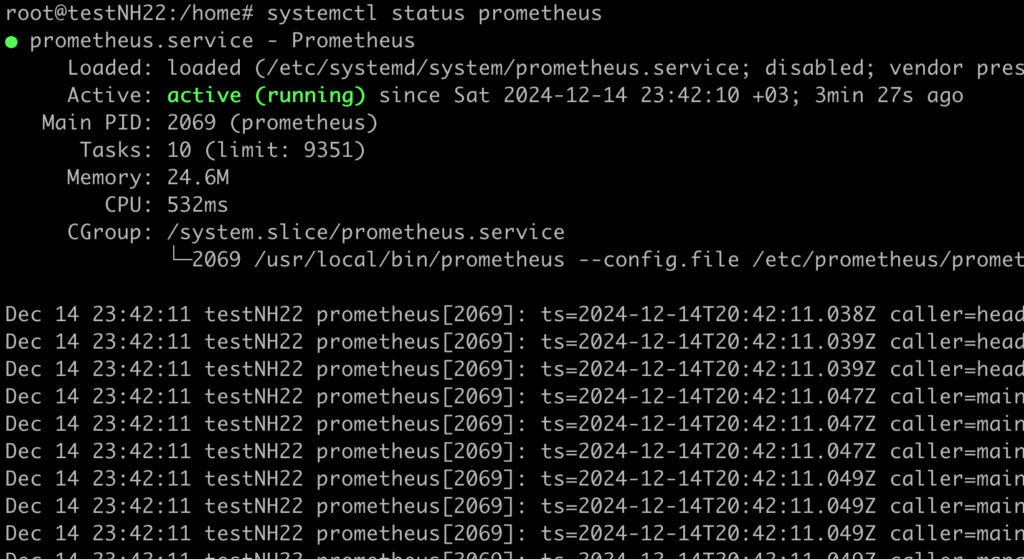
systemctl status prometheus
systmectl enable prometheussudo ufw allow 9090Important File Locations
- Configuration file: /etc/prometheus/prometheus.yml
- Data directory: /var/lib/prometheus
- Binaries: /usr/bin/prometheus, /usr/bin/promtool
Access the Web UI
After installation, Prometheus runs on port 9090. You can access the web interface using your browser. If you are running on a VM:
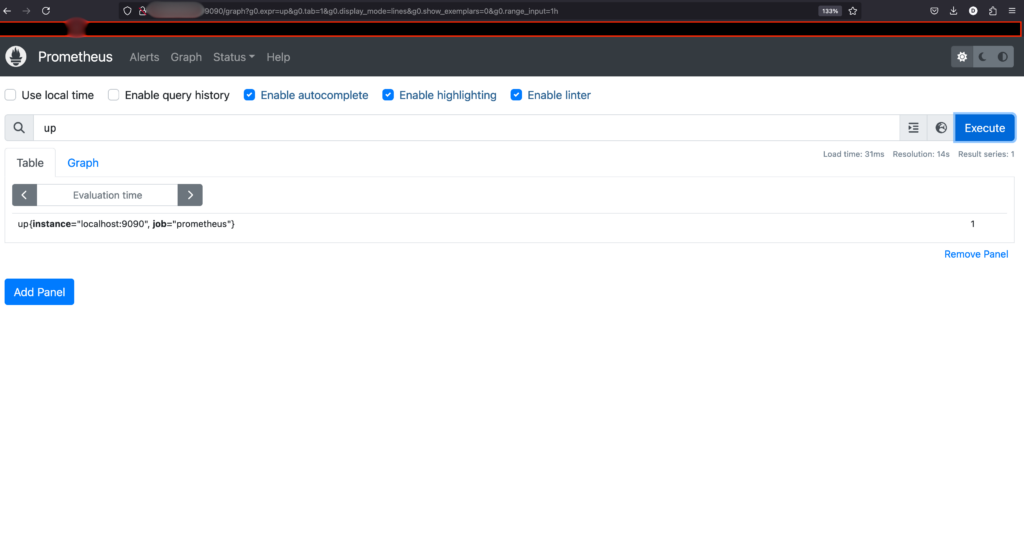
This interface allows you to explore metrics, query time-series data using PromQL, and visualize collected data.
Extending the Infrastructure with Grafana and MySQL Metrics
To fully showcase Prometheus’s capabilities, in a Kubernetes Cluster setup, we could also deploy Node Exporter and Alertmanager to monitor nodes and trigger alerts. However, that detailed Kubernetes installation will be covered in my second post.
To keep this article concise, we will focus on visualizing metrics by installing Grafana. Additionally, we’ll set up a MariaDB instance on the same Linux server and use Prometheus’s mysqld_exporter to monitor database metrics.
This approach allows you to:
- Visualize system and application metrics in real-time.
- Track database performance, queries, and health.
- Get hands-on experience with Prometheus exporters and Grafana dashboards.
By combining Prometheus with Grafana and mysqld_exporter, you gain a simple yet powerful monitoring solution that is scalable and can be expanded later to include nodes, services, and alerting systems.
MariaDB Installation
apt install mariadb-server

systemctl start mariadb

systemctl enable mariadb
Create a Database User for Exporter:
sudo mysql
CREATE USER ‘exporter’@’localhost’ IDENTIFIED BY ‘password’;
GRANT PROCESS, REPLICATION CLIENT, SELECT ON . TO ‘exporter’@’localhost’;
FLUSH PRIVILEGES;
mysqld_exporter installation:
wget https://github.com/prometheus/mysqld_exporter/releases/download/v0.14.0/mysqld_exporter-0.14.0.linux-amd64.tar.gztar xvf mysqld_exporter-0.14.0.linux-amd64.tar.gz
cp mysqld_exporter /usr/local/bin/Add service as a systemd service:
sudo vi /etc/systemd/system/mysqld_exporter.serviceDescription=Prometheus MySQL Exporter
After=network.target
[Service]User=root
ExecStart=/usr/local/bin/mysqld_exporter \
–config.my-cnf=/etc/mysql/my.cnf Restart=always
[Install] WantedBy=multi-user.target
Reload systemd and start the exporter::
sudo systemctl daemon-reload

sudo systemctl start mysqld_exporter

sudo systemctl enable mysqld_exporter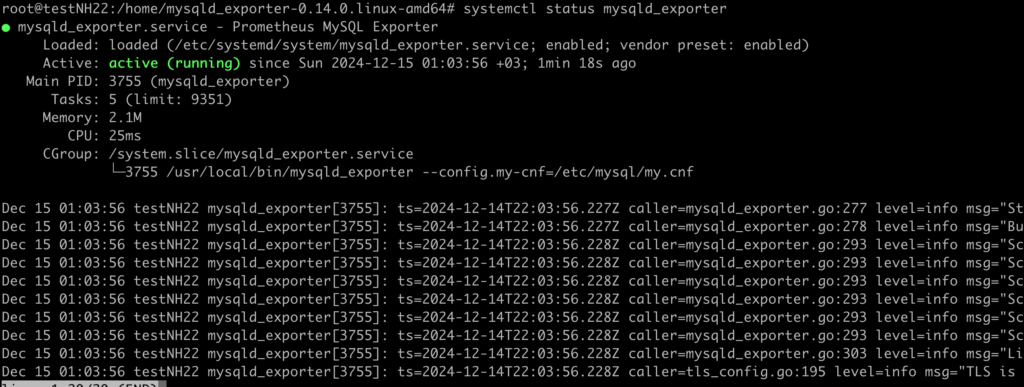
Add a Prometheus Job for MySQL Metrics:
YAML is indentation-sensitive. Be careful with spaces to avoid configuration errors.
vim /etc/prometheus/prometheus.yml


-job_name: "prometheus" static_configs:

-targets: ["localhost:9090"]

-job_name: "mariadb" static_configs:

-targets: ["localhost:9104"
After saving, reload Prometheus to apply the new configuration.:
systemctl restart prometheus
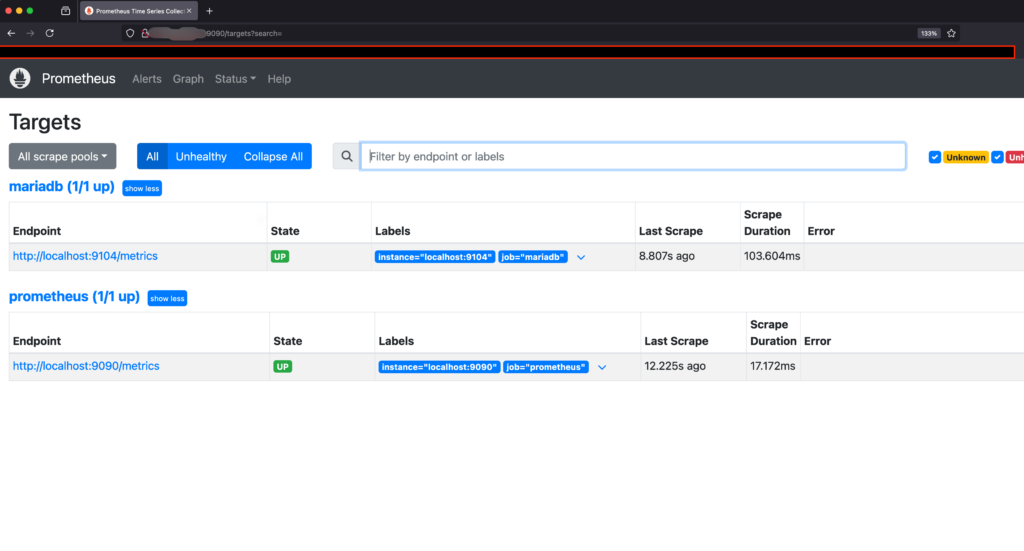
Now, when you access the Prometheus web interface, the MariaDB target should appear as up, indicating that the exporter is successfully running and metrics are being collected.
You can view MariaDB metrics directly in the Prometheus WebUI. For example, a common query is:
mysql_global_status_connections
If you have external Linux servers, such as RHEL machines, and want to monitor them, you can use the Node Exporter. Download it on the external server, then add it as a target in your Prometheus configuration file (/etc/prometheus/prometheus.yml) on the server where Prometheus is installed.
Node Exporter download link:
https://github.com/prometheus/node_exporter
Grafana Installation
If RedHat
yum install -y https://dl.grafana.com/enterprise/release/grafana-enterprise-11.1.0-1.x86_64.rpmIf Ubuntu you gpg:
apt-get install -y software-properties-common

mkdir -p /etc/apt/keyrings/
wget -q -O - https://apt.grafana.com/gpg.key | gpg --dearmor | sudo tee /etc/apt/keyrings/grafana.gpg > /dev/nullecho "deb [signed-by=/etc/apt/keyrings/grafana.gpg] https://apt.grafana.com stable main" | sudo tee -a /etc/apt/sources.list.d/grafana.listapt update
apt install grafana
grafana-server -vStart grafana service:
sudo systemctl start grafana-server

sudo systemctl enable grafana-server
Use yor browser to access grafana:
http://<sunucu_IP_adresi>:3000
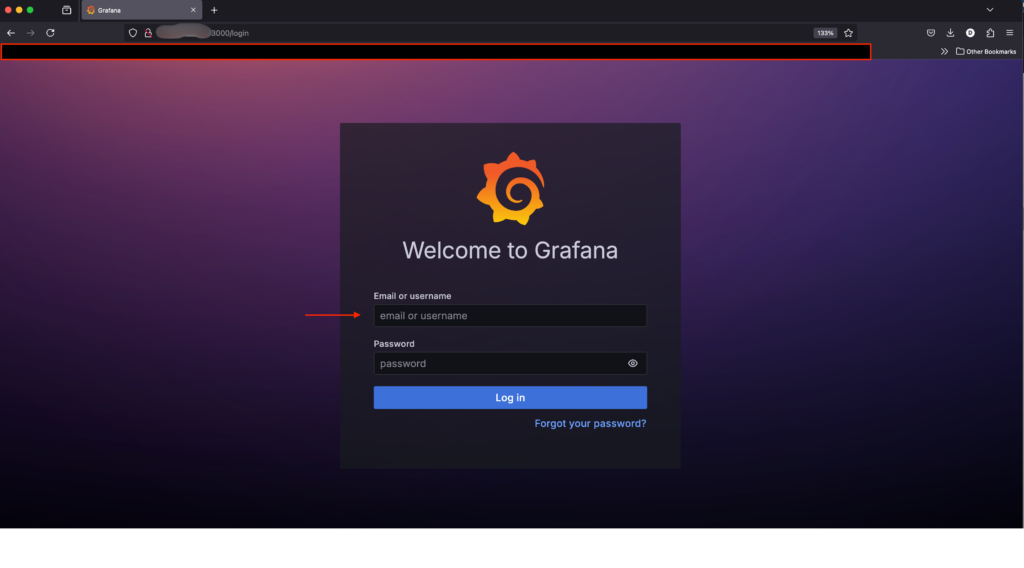
Default Grafana Login Credentials
When you first access Grafana, the default username and password are:
- Username: admin
- Password: admin
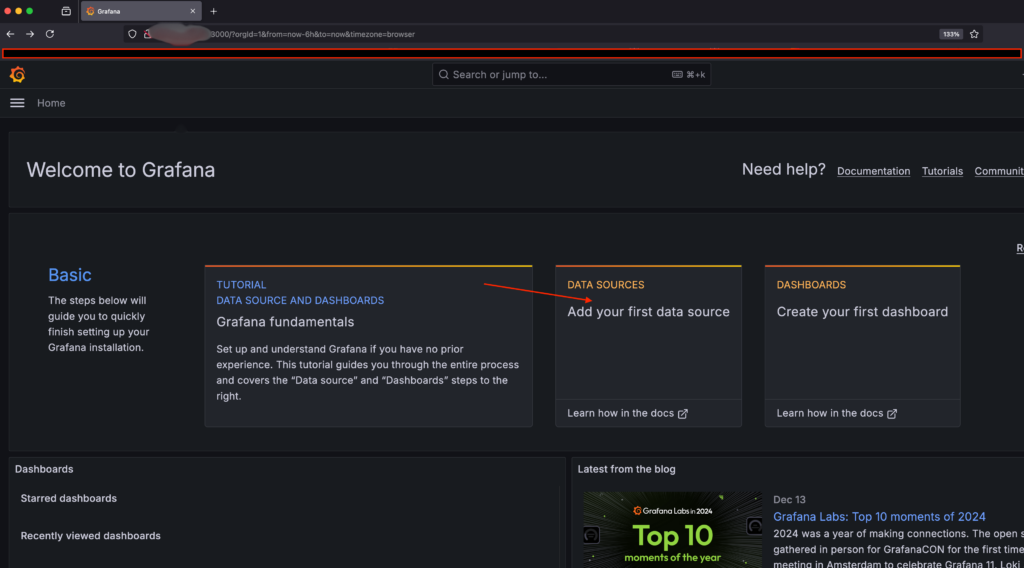
Click “Add your first data source” button
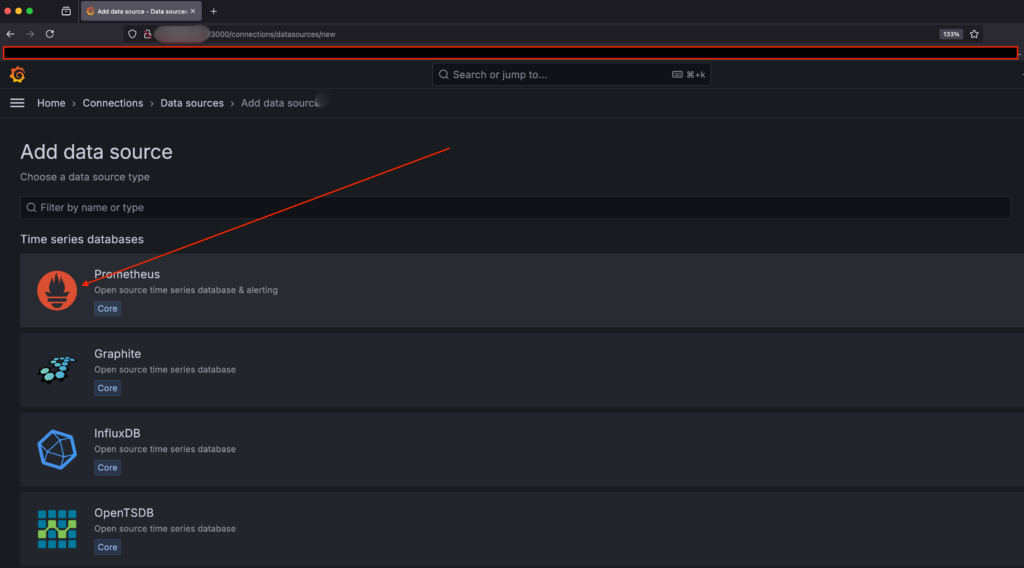
•Choose Prometheus.
• Paste URL of prometheus: http://localhost:9090
• “Save & Test” button
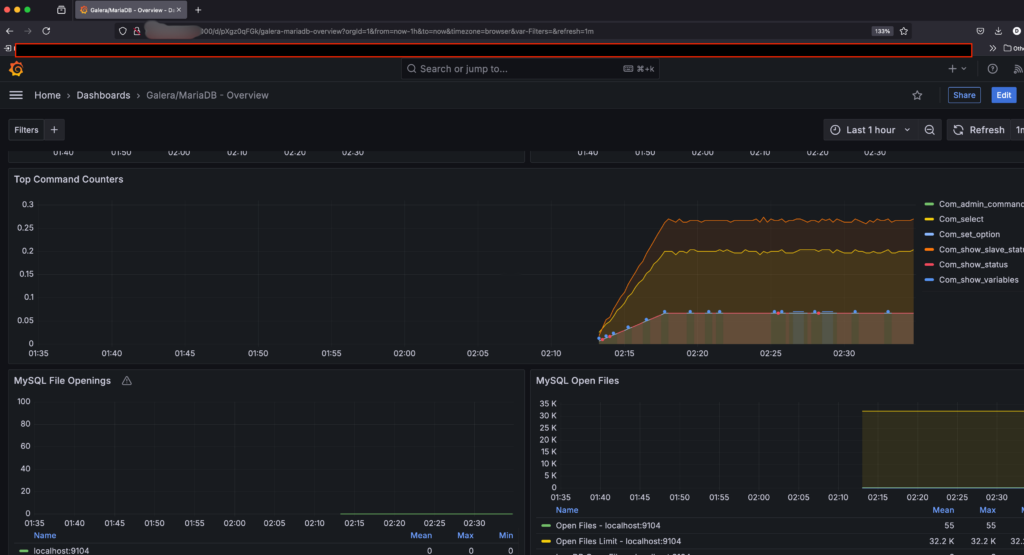
- After adding Prometheus as a data source in Grafana, visit the official Grafana dashboard repository: https://grafana.com/grafana/dashboards
- Search for a MariaDB dashboard.
- Copy the dashboard ID and click the Load button to import it into your Grafana instance.
- In the Query tab of the dashboard, ensure that the data source is set to Prometheus.
This setup will allow you to visualize MariaDB metrics collected by Prometheus’ mysqld_exporter in real time.
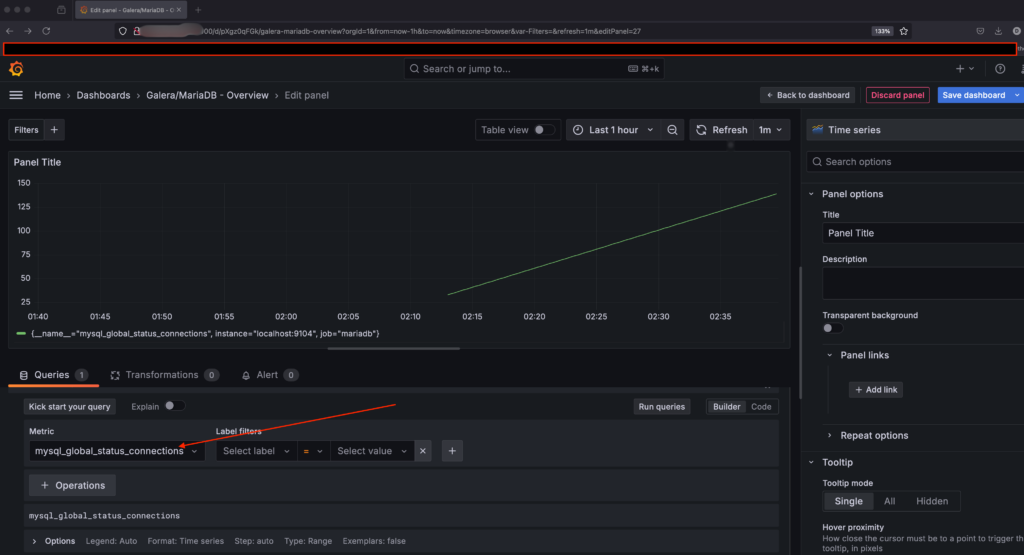
To ensure that Grafana dashboards work correctly, Prometheus must collect accurate metrics. Follow these steps to verify:
- Check Prometheus functionality: Run a query in Grafana to ensure that metrics are being collected and displayed properly.
- Example query:
mysql_global_status_connections 3. Interpret the result:
This query displays the number of active MariaDB connections. If you receive results, it confirms that Prometheus is correctly collecting and providing the data.
Proper metric collection in Prometheus is essential for accurate visualization in Grafana, enabling real-time monitoring of your MariaDB and other system components.
Once Grafana is installed, you can configure it to access your Prometheus targets
- job_name: "mariadb"
  static_configs:
    - targets: ["localhost:9104"]
As an optional enhancement , Install Prometheus Alertmanager to receive email notifications when specific thresholds are crossed:
sudo apt install prometheus-alertmanager
Alertmanager Installation
Use package manager to install alertmanager
sudo apt update
sudo apt install prometheus-alertmanager -y
Start the service:
sudo systemctl enable prometheus-alertmanager
sudo systemctl start prometheus-alertmanager
Alertmanager Configuration file path ( /etc/prometheus.alertmanager.yml)
Creating alerts Using Gmail SMTP :
global:
  smtp_smarthost: 'smtp.gmail.com:587'
  smtp_from: '[email protected]'
  smtp_auth_username: '[email protected]'
  smtp_auth_password: '*app_password'
  smtp_require_tls: true

route:
  receiver: 'mail-alert'

receivers:
- name: 'mail-alert'
  email_configs:
  - to: '[email protected]'
    send_resolved: true
You need to generate app paswword on your gmail profile.
After that restart alertmanager service:
Add your alertmanager in (prometheus.yml )
alerting:
  alertmanagers:
    - static_configs:
        - targets:
            - "localhost:9093"
Under the Targets array , add your other objects necessary if you like.
Making alert definitions ( etc/prometheus/rules/alert.rules.yml)
You can define alerting rules in Prometheus to monitor resource usage. For example, here are simple rules for high CPU and high memory alerts
https://samber.github.io/awesome-prometheus-alerts/rules
groups:
  - name: node_alerts
    rules:
      - alert: HighCPUUsage
        expr: 100 - (avg by(instance)(rate(node_cpu_seconds_total{mode="idle"}[2m])) * 100) > 90
        for: 2m
        labels:
          severity: critical
        annotations:
          summary: "High CPU usage on {{ $labels.instance }}"
          description: "CPU usage is over 90% for more than 2 minutes."

      - alert: HighMemoryUsage
        expr: (1 - (node_memory_MemAvailable_bytes / node_memory_MemTotal_bytes)) * 100 > 90
        for: 2m
        labels:
          severity: warning
        annotations:
          summary: "High memory usage on {{ $labels.instance }}"
          description: "Memory usage is above 90% for more than 2 minutes."
Define this alarm on prometheus.yml
Adding alarm rule path in Prometheus config file (/etc/prometheus/prometheus.yml) :
rule_files:
  - "/etc/prometheus/rules/alert.rules.yml"
Common Errors During Installation and Their Solutions
When starting the Alertmanager service, you may encounter the following warning:
ts=2025-04-20T19:54:20.350Z caller=cluster.go:177 level=warn component=cluster err="couldn't deduce an advertise address: no private IP found, explicit advertise addr not provided"
Solution
Edit your systemd service file, either /lib/systemd/system/prometheus-alertmanager.service or a custom service file, and add the following line under [Service]:
[Service]
ExecStart=/usr/bin/prometheus-alertmanager --cluster.advertise-address=0.0.0.0:9093
This explicitly sets the advertise address and resolves the warning.
In my next post, I will demonstrate how the same Prometheus stack setup can be simplified using Helm Charts and deployed efficiently within a Kubernetes Cluster.