For decades, Linux systems administrators and SREs have relied on a trusty toolkit of command-line utilities. Commands like top, ps, iostat, and netstat are muscle memory for anyone who has ever needed to debug a slow server.
However, as architectures shift toward microservices and containers, and as hardware becomes faster, these legacy tools are showing their age. They are often limited by sampling rates, aggregate statistics that hide outliers, and a lack of context regarding kernel-level events.
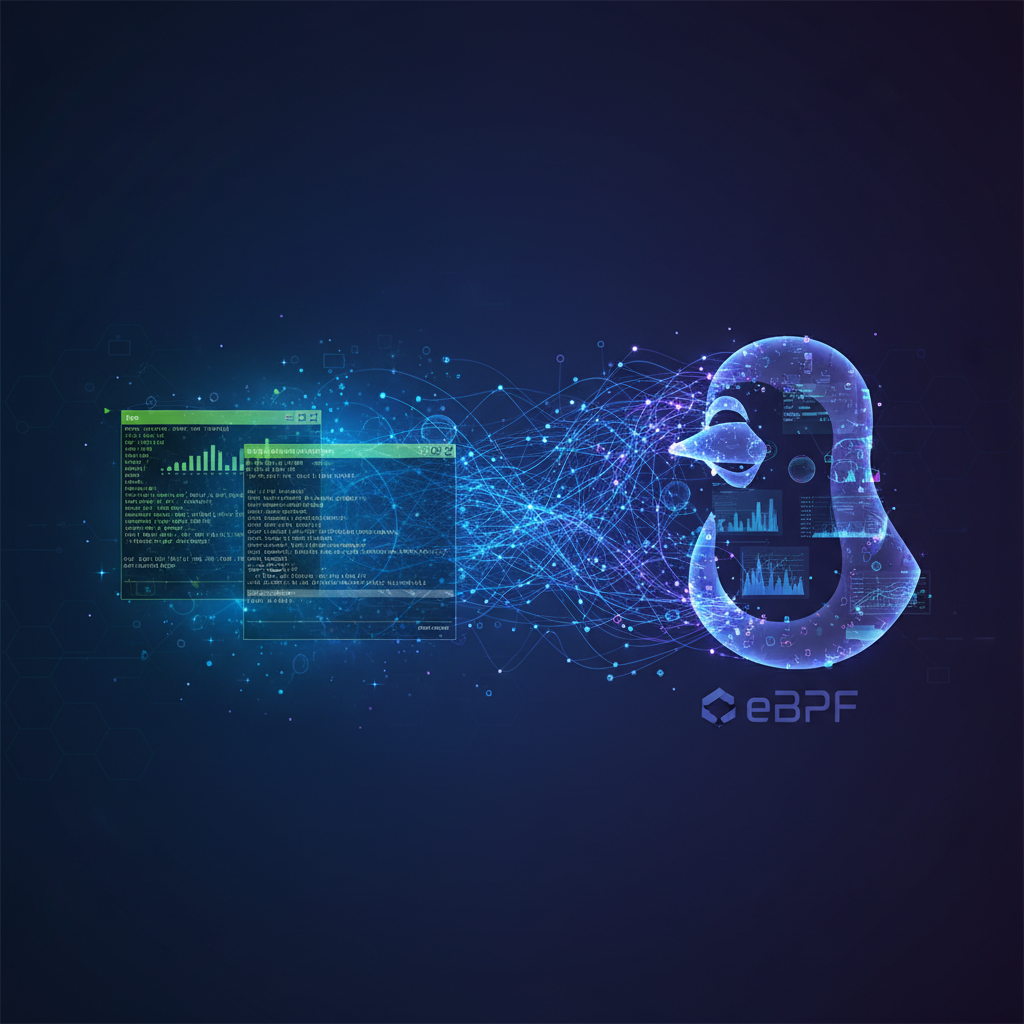
Enter eBPF (Extended Berkeley Packet Filter). This technology has ushered in “Performance Analysis 2.0,” allowing for safe, efficient, and deep visibility into the Linux kernel without requiring kernel modules or system restarts.
This post explores the limitations of legacy tools and how to transition to the eBPF ecosystem for superior observability.
The Limitations of Legacy Tools
Legacy tools typically operate by reading text files from the /proc filesystem. While efficient for high-level overviews, this approach has significant drawbacks for deep debugging:
- Sampling Bias: Tools like
toptypically refresh every 1 to 3 seconds. Short-lived processes that start and finish between refreshes are invisible. - Averages Lie:
iostatmight tell you the average disk latency is 2ms. It fails to show that 99% of requests are 0.1ms, but a few critical requests are stalling for 500ms. - Lack of Context:
netstatshows current connections, but it cannot trace the lifecycle of a dropped packet or tell you which specific function call caused a latency spike.
What is eBPF?
eBPF is a revolutionary technology that allows you to run sandboxed programs in the Linux kernel. It works on an event-driven model:
- Event Source: You attach a program to a specific event (a system call, a function entry, a network packet arrival, etc.).
- Execution: When that event occurs, the eBPF program runs instantly in the kernel context.
- Data Map: The program stores data (counts, histograms, stack traces) in maps.
- User Space: A user-space tool reads the map and formats the data for humans.
Because eBPF runs in a virtual machine inside the kernel, it is safe (it won’t crash the kernel) and highly performant (avoiding expensive context switches for every event).
The Transition Toolkit: Mapping Old to New
To start using eBPF, you don’t need to write C code immediately. The BCC (BPF Compiler Collection) and bpftrace provide front-end tools that act as “supercharged” versions of standard CLI utilities.
Here is how your toolkit should evolve:
1. CPU Analysis
- Legacy:
top,uptime - eBPF:
execsnoop,runqlat,profile
While top shows current CPU usage, it misses short-lived processes. execsnoop traces new process execution via the exec() syscall.
# Using execsnoop to find short-lived processes
sudo execsnoop
Output Example:
PCOMM            PID    PPID   RET ARGS
mkdir            1022   1020     0 /tmp/test
ls               1023   1020     0 -F
2. Disk I/O Analysis
- Legacy:
iostat,iotop - eBPF:
biolatency,biosnoop,fileslower
iostat provides averages. biolatency captures disk I/O latency as a histogram, allowing you to see multi-modal distributions (e.g., cache hits vs. disk reads).
# Measure disk I/O latency distribution
sudo biolatency -m
Output Example:
     msecs               : count     distribution
         0 -> 1          : 984       |**************************************|
         2 -> 3          : 0         |                                      |
         4 -> 7          : 2         |                                      |
         8 -> 15         : 12        |                                      |
        16 -> 31         : 25        |*                                     |
3. Networking
- Legacy:
netstat,ss,tcpdump - eBPF:
tcptop,tcpconnect,tcpretrans
tcpdump is heavy because it copies full packets. tcpretrans only triggers when the kernel retransmits a TCP segment, logging the specific IP and port with near-zero overhead.
# Trace TCP retransmits live
sudo tcpretrans
Power User Mode: Ad-Hoc Scripting with bpftrace
Sometimes a pre-built tool doesn’t exist for your specific problem. This is where bpftrace shines. It uses a syntax similar to awk and C to create powerful one-liners.
Example: Who is opening files?
If you want to know every time a process opens a file, you can trace the openat system call.
sudo bpftrace -e 'tracepoint:syscalls:sys_enter_openat { printf("%s opened %s\n", comm, str(args->filename)); }'
Example: Profiling On-CPU User Stacks
Instead of using a heavy profiler, you can sample running stacks at 99 Hertz to visualize where CPU time is actually spent.
sudo bpftrace -e 'profile:hz:99 { @[kstack] = count(); }'
Moving to Production
The transition to eBPF is not just about having cooler tools; it is about production safety and efficiency.
- Low Overhead: Because data aggregation happens in the kernel, you only send summaries to user space, saving CPU cycles compared to passing full logs.
- Safety: The eBPF verifier ensures your tracing scripts cannot cause infinite loops or illegal memory access.
- Zero Modification: You can trace any function in the kernel or in user-space applications (like MySQL, Python, or Node.js) without recompiling the application.
Conclusion
Linux Performance Analysis 2.0 is a paradigm shift from sampling the state of the system to tracing the actual events occurring within the kernel. While legacy tools like top and iostat serve a purpose for quick health checks, they lack the fidelity required for complex modern environments.
By adopting tools from the BCC collection and learning basic bpftrace one-liners, you gain the ability to answer the “why” behind the “what,” turning opaque system lag into solvable engineering problems.
Start by installing bpfcc-tools (on Debian/Ubuntu) or bcc-tools (on RHEL/CentOS) and running execsnoop. You might be surprised at what is running on your system right now.


